There are many candlestick patterns that occur over and over. These patterns are extremely useful in determining a stock’s next move. Think of them as your own fortune-teller. I will illustrate three of the most powerful.
A doji is a candlestick pattern frequently found at the bottom of a stock’s move down, and thus is considered as a sign of a reversal in the price’s direction. It is characterized by a candle with wicks at both top and bottom. This shows that the price closed in the middle of the day’s range.
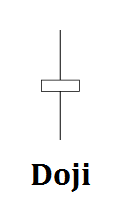
A doji appearing at the end of a long price decline can point to a change to higher prices. It shows buyers stepping back in and pushing the price up from a bottom.
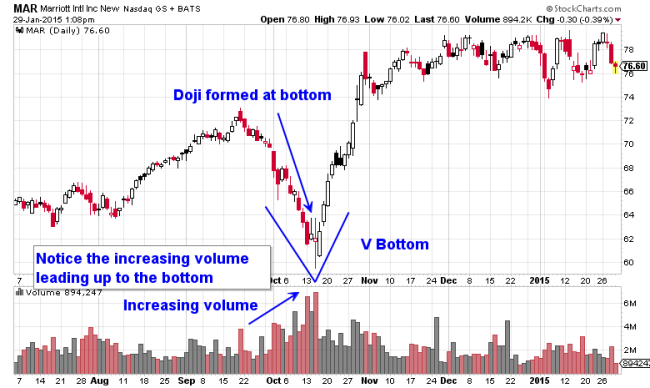
Dojis are frequently found in a V bottom pattern, as seen in the Marriott chart below:
Chart courtesy of StockCharts.com
(Click to enlarge)
Two other powerful candlestick patterns are hammers and shooting stars (reverse hammers). They take their name from their look on a candlestick chart. They are variations of the doji pattern.
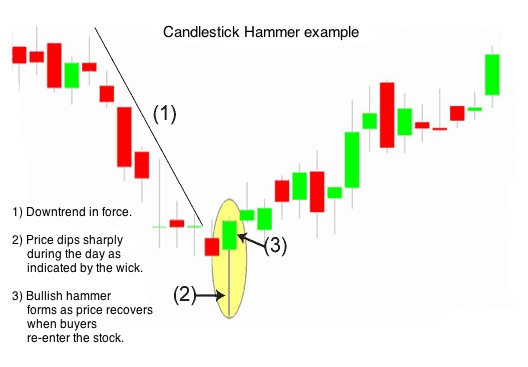
A hammer is a doji that closes towards the high of the day, not in the middle.
Hammers are bullish reversal patterns that many times indicate the end of a price decline, and beginning of a rally. It shows buyers coming back into a stock at the end of a day, forcing the price well off the lows of the day.
The result is that the day’s price movement looks like a hammer, with a long handle and a small hammer top.
(Click to enlarge)
A shooting star is a doji that closes towards the low of the day, not in the middle.
Shooting stars, also called reverse hammers, are bearish patterns that many times predict an imminent price decline in the days ahead.
They show that prices made a new high during the day, but ended up on or near the lows of the day. This indicates that sellers overran buyers at the end of the day, which many times leads to more selling in the coming days.
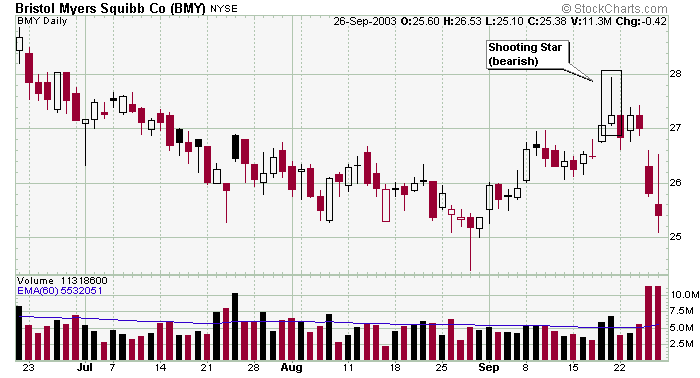
In the example below, the shooting star or reverse hammer appeared on September 21st. Prices then reversed and continued lower. The reverse hammer foretold a change in direction and lower prices.
In this example, also notice the hammer on August 28th. It showed a reversal of the downtrend and a change to higher prices. The reverse hammer foretold a change in direction and lower prices.
Chart courtesy of StockCharts.com
(Click to enlarge)