A trend confirmation is comparing two or more market indexes to confirm the direction of the trend. In Dow Theory, the Dow Jones Industrial Average and Transport Average must make new highs simultaneously. This is a confirmation of the main uptrend. This is a green traffic light.
If one average makes a new high without the other, called divergence, there is a non-confirmation that is a warning to be cautious. This is like a yellow traffic light.
Another example is comparing gold-mining stocks relative to the price of gold. If both the mining stocks and gold are making new highs, this is a confirmation.
If the stocks stop rising, while gold is still rising, this is a divergence that warrants caution or maybe even the selling of the stock position. In this specific example, repeatedly I have found that the gold-mining stocks eventually stop rising while gold continues to rise. Almost without fail there is a big sell-off in the stocks once gold itself changes direction to the downside. This divergence is a good early warning indicator to take profits off the table when it happens.
It is useful to look at charts for the Dow, the S&P 500, and the NASDAQ. Look for confirmation between all of them to confirm a move.
If all are making new lows, for example, then the trend is confirmed as down. However, if the S&P 500 and NASDAQ stop making lows while the Dow still declines, that may foretell the end of the downward trend. It is showing that the bigger universe of 1,000+ stocks represented by the S&P 500 and NASDAQ are finding a bottom in prices, even while the smaller number of 30 stocks in the Dow are not.
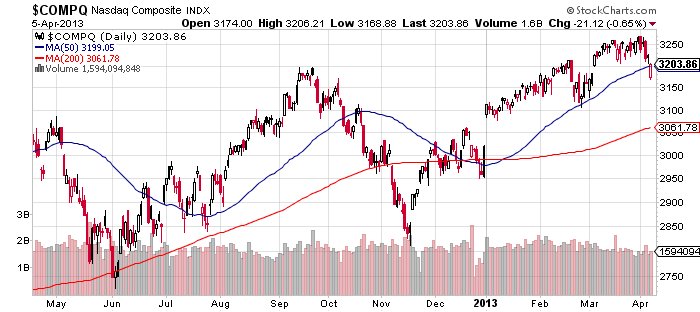
Notice in the following charts of the Dow and NASDAQ that they all have similar price movement. Both charts are for the same time period.
Even though both show a correction in price from September through November 2012, the lows in November are higher than the lows shown back in June.
Both charts show a new bull market starting in November that leads to new highs in April 2013. This pattern of higher lows in a chart confirmed an uptrend.
Chart courtesy of StockCharts.com
(Click to enlarge)

Chart courtesy of StockCharts.com
(Click to enlarge)
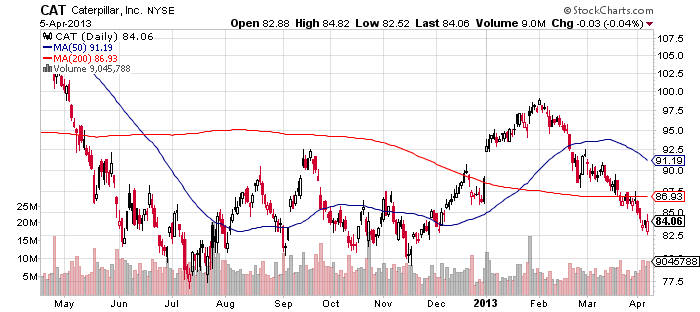
However, look at this chart for Caterpillar (CAT), a large equipment manufacturer. This chart is from the same time period as the previous index charts. The stock topped out in early February and is heading lower.
Notice that the stock never made a new high above the price at the beginning of the chart. This stock is definitely acting weaker than the Dow or NASDAQ and is diverging from the indexes’ uptrend. If you owned Caterpillar, this would be a warning flag.
Chart courtesy of StockCharts.com
(Click to enlarge)
Yahoo Finance charts allow you a quick way to compare a stock against the Dow, S&P 500, or NASDAQ simply by clicking a button. Here is a chart of Caterpillar compared against the Dow. The Dow is in green, and CAT is in the blue and white candlesticks. You can easily see the divergence.
Chart courtesy of Yahoo Finance
(Click to enlarge)
