Below are some useful tickers that you can use at StockCharts.com to look up various indexes and financial items.
They use the $ sign to denote an index.
| SYMBOL | NAME |
|---|---|
| $INDU | Dow Jones Industrials |
| $SPX | S&P 500 Index |
| $TRAN | Dow Transports |
| $TNX | 10-Year Treasury Note |
| $XAU | Gold and Silver Index |
| $GOLD | Gold – Spot Price |
| $SILVER | Silver – Spot Price |
| FXI | iShares China |
| $USB | 30-Year Treasury Bond |
| XHB | Homebuilders Index |
| GDX | Market Vectors Gold Miners |
| $XEU | Euro |
| $NYA50R | % Of NYSE Stocks Above 50MA |
| $NYAD | Advance-Decline |
| $USD | U.S. Dollar Index |
[gpp_divider type=”dashed” color=”green”][gpp_divider type=”dashed” color=”green”]
You’ve made it to the end of your first lesson on charting – congratulations! A lot was covered in this module, so please feel free to go through it again if you didn’t quite get all of it.
To help you put your new knowledge to use, please complete the following Action Step.
Go to StockCharts.com and enter the following stock tickers one by one:
GOOG
CAVM
JNJ
FB
TRN
JCP
For each stock, start with the default Daily charts. Look to determine the following things:
[gpp_divider type=”dashed” color=”green”]
The charts you have been using throughout this module are candlestick charts. In the next section, you will learn more about candlesticks and how to use them.
Candlesticks are chart indicators that show the open, high, low, and closing prices on a chart. They are a great way to see a stock’s price movement during each period represented on a chart.
Most of our example charts are daily charts, so each candle represents one day. With daily charts you see the open, high, low, and closing prices each day represented by a candle. You can look at charts that range from minutes to months, and each candle would represent that time period.
The colored-in portion of each candle is the body, and indicates where the stock opened and closed. The “wick” part of each candle shows the price movement outside of the open and closing prices.
The closing price each day is the most important price to consider. The color of a candle gives you a fast way to determine a closing price – a white candle shows a higher close than the day before, and a red candle shows a lower close than the day before. Note that Yahoo Finance charts use white and blue candles; the color doesn’t matter.
Occasionally you will see a black candle. A black candle appears if the previous day’s closing price is less than or equal to the closing price for the current day. In simple terms, the price closed lower than the previous day, making it an alternate red candle.
Black candles are somewhat rare, so to make things easier consider them as red candles.
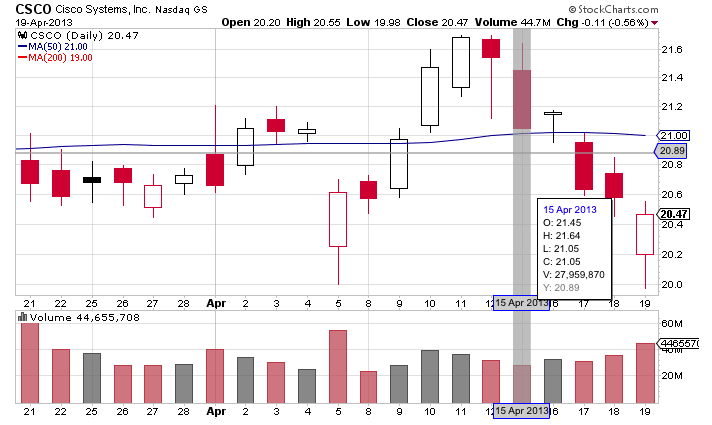
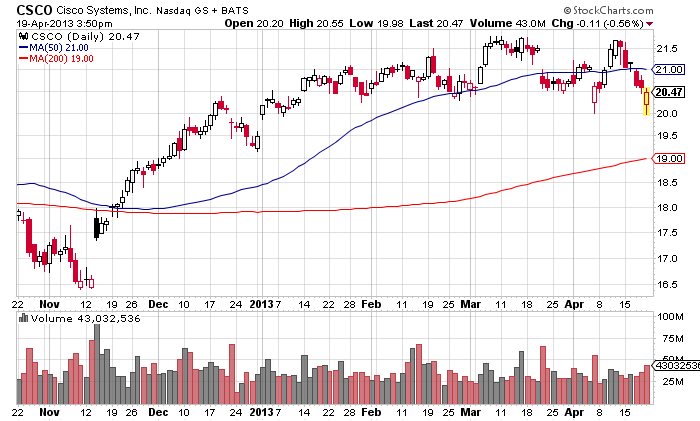
Let’s look at a chart of Cisco Systems. The white candles show the price ended higher than the previous day, and red candles show the price ending lower than the previous day.
Chart courtesy of StockCharts.com
(Click to enlarge)
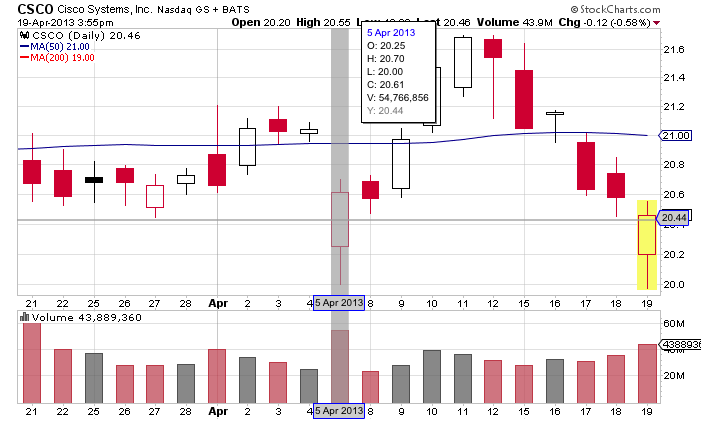
To illustrate this more clearly, let’s zoom in on the candles in April (see chart below).
On April 5th, (the day illustrated in grey) the stock opened at 20.25, the bottom of the white body.
At some point during the day the stock dropped to 20.00, and rose up to 20.70. It closed the day at 20.61. In the little box dated 5 Apr 2013, you can see the stats for that day.
O = open price
H = high price
L = low price
C = closing price
V = volume traded
The candle was filled in white for this day because it closed higher than the previous day.
Chart courtesy of StockCharts.com
(Click to enlarge)
Let’s look at another candle in this chart (see chart below).
On April 15, the candle was red because it closed lower than the previous day. In addition, it has no wick on the bottom because it closed on its low. Notice in the little window that the L and C are both 21.05.
A red candle closing on its low usually signals continuing lower prices going forward, and you can see that prices did continue lower after this candle. This is a bearish candle showing sellers are in control that day.
Chart courtesy of StockCharts.com
(Click to enlarge)