Long-Term Outperformers (LTOs) are stocks that move slowly but surely upwards, producing substantial gains over many months and years.
These leaders exhibit consistent price appreciation and stable earnings and sales growth over many months and years. Their gains usually have far outperformed both the majority of stocks and the major stock indexes.
Some of these companies are well-known household names, but there will be others that you have never heard of, like Tyler Technologies, Rollins, or Pool Corp. These are the hidden gems that are off most investor’s radar and are waiting to be discovered by you.
One of the reasons that Long-Term Outperformers frequently aren’t well-known among the public is that they are slow movers. They don’t attract a lot of attention like the fast “racehorse” stocks that make the headlines in the media.
However, they do attract the attention of the best fund managers who have the resources to research and invest in the best companies available.
These funds love companies that have stable and very profitable businesses, and they’re always looking to add to or support their positions over many months and years.
It’s this continuous investment from top funds over the years that makes them big long-term gainers.
LTO stocks are characterized by generally slow but steady price performance over time. Many tend to be mature companies that have passed their initial high-growth phase but still have thriving dependable businesses.
Overall, their price-performance tends to be less volatile than other growth stocks, which makes holding them easier during market corrections.
A primary reason you should consider LTO stocks is their vast outperformance vs. the S&P 500 over time.
The following chart shows the return of the S&P 500 (in pink) vs. a few LTO stocks like Adobe (ADBE) Pool Corp (POOL), Edwards Lifesciences (EW), Tyler Technologies (TYL), and Intuitive Surgical (ISRG) over the last 20 years.
(Click to enlarge)
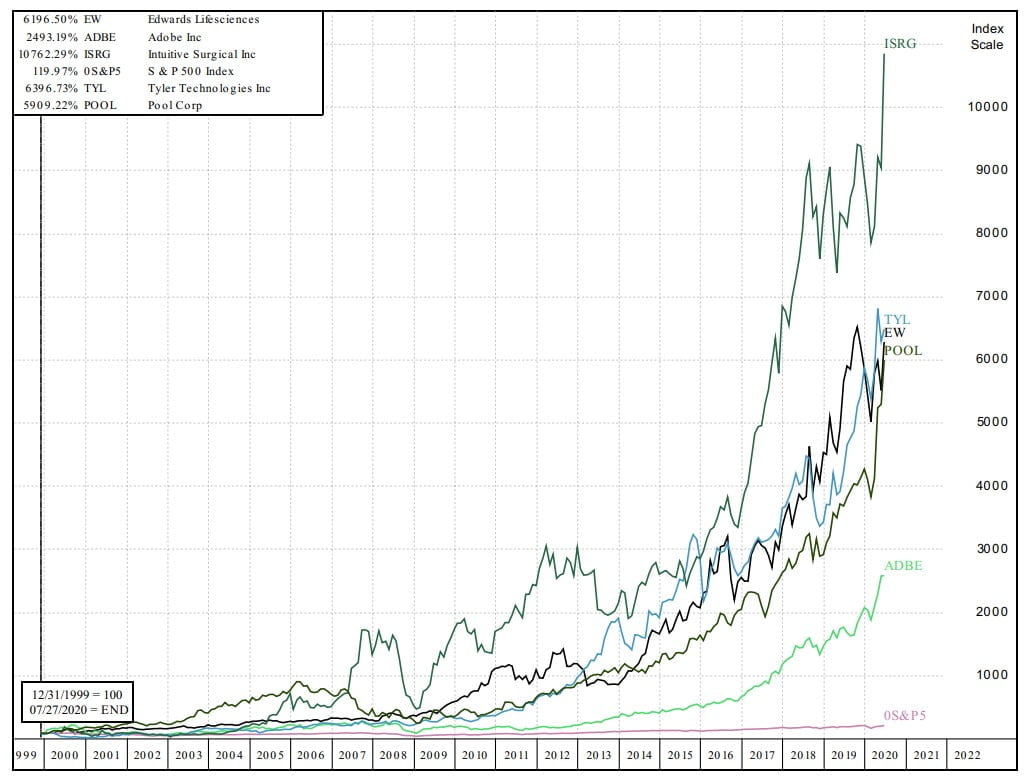
As you can see, these stocks hugely outperformed the S&P 500.
So, how do you find these long-term leaders? Let’s get into the fundamental and technical characteristics of a typical LTO stock.
To find long-term outperformers, we want to look for the following fundamental criteria:

LTO stocks all have very stable earnings that are rising year over year.
In the following chart for Accenture (ACN), you can see the annual earnings per share (EPS) have been rising steadily for the last eight years and are projected to increase in 2021.
(Click to enlarge)

LTO stocks generally show 3- and 5-year earnings growth rates from low single digits to upwards of 25%.
Sales should be stable and positive year over year for the last five years minimum.
Sales growth should be at a minimum of 5% per year.
Investments from mutual funds, banks, and institutional investors are what propel LTO stocks upwards year after year. You want to see institutional ownership by some of the best funds like Fidelity Contrafund, Franklin Growth, MFS Growth, and others.
The best long-term outperformers will also show healthy pre-tax and after-tax profit margins and a return on equity (ROI) of at least 10%.
LTO stocks will have the following technical characteristics, as seen in their charts.
The best way to determine if a stock is a long-term outperformer of not is to check out its monthly chart. The following chart of Rollins shows the characteristics we are looking for:
(Click to enlarge)

As you can see, Rollins has been in an uptrend since 2000. Its overall price movement has been slow and steady throughout its move. While there have been price corrections along the way, they have generally been short and shallow.
The longer-term moving averages should have provided support during its run.

Large institutional investors like to add and/or support their stocks at key levels like the 50-day/10-week moving average, the 200-day/40-week moving average, and the 21-month and 40-month moving averages.
In the following chart of Rollins, notice that the stock has remained above its 21-month moving average since 2009:
(Click to enlarge)

Also, notice that while it pierced its 40-month moving average four times since 2000, it never actually closed below that moving average. That shows support from institutional investors.
Another important point is that the moving averages should continue to be in an uptrend.
The previous chart shows both the 21- and 40-month moving averages have remained in uptrends since 2002.
Here are the screening criteria I use to find LTO stocks. Depending on your screener software, you may not have access to all these criteria.

The following video first shows some model book long-term outperformers so you know what to look for fundamentally and technically. Then I go through some current LTO stocks.
Subscribers to our Market Trend Advisory and Stock Lists service receive access to a list of long-term outperformers using these screening parameters. This list is updated each week.
They also get access to our Long-Term Outperformer portfolio.
Click here to learn more.
LTO stocks are about buy and hold, not trading. Ideally, you buy them once and hold on until a sell signal develops, hopefully, many years down the road!
You want to establish a position that eventually has a large profit cushion built in so you can withstand any market corrections without getting stopped out.
LTO stocks can be bought any way you usually buy stocks:
To get the lowest cost position, consider waiting until the stock falls back to its 21- or 40-month support and shows it is getting support there.
You’ll be buying at or near what hopefully is the bottom of a correction, giving you a low-cost basis position.
Finally, make sure you are buying only in a market uptrend.
The best time to buy is at the start of a new uptrend. That’s when LTO stocks start bouncing off their moving averages and head higher.
Our Market Trend Advisory will help make sure you get invested in every new uptrend.
If you’re not already a subscriber, you can check it out here.
As you check out LTO candidates, you’ll notice that many have already had substantial multi-year runs.
But as long as they still have all the fundamental and technical characteristics, you can look to purchase them.
Also, look for newer candidates that haven’t yet made big runs. These stocks may become the next multi-year long-term leaders!
Most LTO stocks are slow but steady movers, so don’t expect substantial price moves in a short amount of time.
It may take weeks at times for the stock to go up 5%, or it will go back and forth for months without any price appreciation.
This is normal.
You don’t want excitement with LTO stocks – you just want steady price appreciation over time.
Even before you have accumulated substantial gains in a stock over time, you should have in place a plan to eventually lock in our profits.
Your choices are to use defensive and/or offensive selling rules.
Sell signals may be technical or fundamental. The technicals tend to lead the fundamentals by a quarter or two.
Technical sell signals are mostly defensive sell signals. That means you’ll end up selling during a correction, not at a price peak.
The primary technical sell signal will be a break below the 40-week, 21-month, or 40-month moving averages, or whatever longer-term moving average that has provided support for the whole move.
Another common technical sell signal is that the stock’s character starts to change. If you notice that it is undergoing more significant corrections than normal, or it is not advancing while the general market is (over weeks and months, not just days), then it could be a sign the stock is ending its run.
Or, using an offensive sell rule, you could elect to take some profits at pre-determined price areas, like if you are up 100% or more from your purchase price, or at some dollar price target.
A combination of both offensive and defensive sell rules will allow you to take some profits near the top and some after the stock has made its big run.
A primary fundamental sell signal is that the stock has one or two quarters of negative earnings and/or sales growth. It is now breaking down from its normal positive earnings growth, a warning sign.
Another sell signal is that it is no longer qualifies for the screening criteria that put it on the LTO list in the first place. Maybe the ROI drops substantially or goes negative, or its quarterly sales drop to zero or go negative.
These are all changes from its usual performance that should be monitored and acting upon if necessary.
Long-Term Outperformers can add substantial gains to a portfolio while at the same time reducing overall volatility.
Be sure to spend some time each week checking out current long-term outperformers so you can find potential candidates that are set up to buy.
—————————————————————————


sikis izle
This is one awesome article post. Much thanks again. Really Cool. Carolyn Stavro Cleti