One of the most powerful features of the Market Trend Advisory is the Power Trend indicator.
The Power Trend turns on when an index is in a particularly strong uptrend and is consistently moving up into new highs.
Power trends do not happen frequently but when one starts it usually leads to a strong sustained uptrend.
Remember, about 75% of stocks will follow the market indexes, so when a power trend appears the majority of stocks will follow this power trend.
For both individual stock investors and stock index/ETF investors, a Power Trend is the ideal time to be invested and/ or get aggressive if that suits your trading style. Outsized gains usually happen quickly and pullbacks in the indexes are usually shallow, with new highs following shortly after pullbacks.
Knowing that the market is in a Power Trend is also extremely helpful when you are scared to invest – for whatever reason – but you know you need to be more invested.
A good metaphor is comparing investing to driving. If you are driving 10 mph in a 55-mph zone, you need to speed up because you are being left behind.
If you are investing 10% in a market that is going 100 mph, you need to get more invested, otherwise you are missing out on a special market environment.
Having a Power Trend on will give you the confidence to invest more during a period where the risk/reward is more heavily tilted in your favor than during regular market conditions.
In the last 100 years, there have only been around 200 power trends. Some last just a week or so, others can last many months. But while we may not know how long the current one will last, you should make the most of it!
One of the longest Power Trends lasted close to 2 years, from October 1953 to August 1955. It’s so long it took 2 daily charts to fit!
(Click image for larger popup)


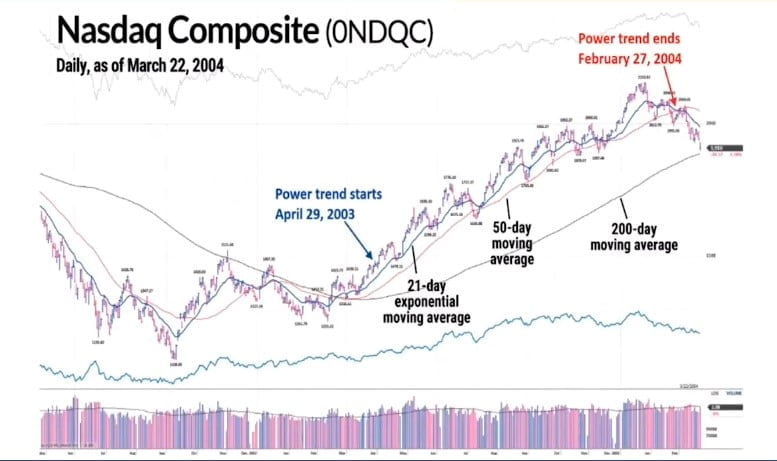
Another example of a Power Trend is from the Nasdaq in 2003-2004. This Power Trend stayed on for close to a year. It helped investors stay invested throughout the choppy movements throughout 2003.
(Click image for larger popup)
Below is a chart of the Nasdaq in our current market (through June 25, 2020). You can see the powerful move that has been in place since the Power Trend started on May 8, 2020:
(Click image for larger popup)

The Power Trend is designed to keep you fully invested during these powerful uptrends.
When the Power Trend turns on, it increases the Market Count to 7 from 5.
Why is this important?
The Market Count is our main indicator of the health of the market.
A high count (5, 6, or 7) shows the market is in a strong uptrend that is trending above its moving averages and has usually shown very little institutional selling.
A low count (4 and below) shows that the market is getting hit with institutional selling which is causing the market to fall below key technical levels like the 21-day and 50-day moving averages.
In any uptrend, it’s not uncommon to have periods where the big institutions start to sell their holdings, sending the indexes lower.

Since no one knows how low or bad the market will get, our regular market rules will have you gradually exiting the market as market conditions worsen and gradually adding stocks when market conditions improve.
What we want to avoid is whipsawing action where we sell positions and having to buy them back soon after.
This is where the Power Trend helps.
Having the market count increase up to 7 from 5 gives you a buffer; you can sit through periods of milder institutional selling without having to get signals to sell or lighten up. The market count can drop all the way to 4 now before any sell signals are generated.
The Power Trend turns on when 1) the 21-day moving average is above the 50-day moving average for at least 5 consecutive days without a break below the 50-day moving average. 2) The index closes up or flat for the day, 3) The 50-day MA is in an uptrend for at least 1 day, and 4) the index low has been above the 21-day MA for 10 consecutive days.
In other words, the index is properly lined up technically and is trending higher.
The power trend turns off when the 21-day moving average crosses below the 50-day moving average, and the index closes down for the day. There are a few other ways it can turn off but this one is the most common.
However, a Power Trend can stay on and move into Under Pressure status. You’ll see these listed in the Power Trend column occasionally.
The rules are complicated so I won’t explain them here, but they are there to help you stay invested effectively when the market trend starts to change.
The start of a power trend is the ideal time to get more aggressive in your trading. Adding positions or adding shares to positions that are working (pyramiding) are two ways to get more invested.
Very aggressive traders will go on margin during this time.
Here is a chart of one of the current growth stocks leaders Fastly (FSLY). This stock and many others have made accelerated gains of over 100% since the Power Trend started less than 2 months ago on May 8th!
(Click image for larger popup)

IMPORTANT NOTE: For individual stock investors, always make sure to heed any technical warning signs or sell signals in your stocks!
The performance of each stock you own overrides any Power Trend or market count indicators that apply to the overall market trend. Use your sell rules to exit stocks according to your investing strategies (and I hope you have sell rules!). You don’t want to let huge gains disappear.
Any individual stock can outperform or underperform the indexes. You, of course, want to be invested with the leaders that are outperforming.
With growth stocks, this is especially true as they are inherently volatile. The leaders will vastly outperform the indexes, while the laggards will underperform.
This chart of current growth leader Zoom (ZM) is vastly outperforming the Nasdaq and S&P indexes. The S&P benchmark is actually declining (the S&P chart is in black on the chart) compared to Zoom.
Again, it really got moving after the Power Trend started on May 8th.
(Click image for larger popup)

Carnival Cruises, however, is a laggard that is in a downtrend and well below its 200-day moving average. Unless you are a deep value investor, you are not making any money here in this vastly underperforming stock.
Notice how the Power Trend status didn’t really help out a stock like this. The brief rise in early June did not last.
(Click image for larger popup)

The Power Trend is a powerful feature of our market timing system that helps you navigate the markets profitably. Be sure to make the most of periods when a Power Trend is in force as they are not that common!
—————————————————————————————————–


Genieknows Trading
I am trying to figure out what trading setup is best for me. I am interested in active and algorithmic trading, but I don’t know which one is best for me. I have a few different options that I am considering, but I don’t know which one is best. I am considering active trading, algorithmic trading, or a combination of both.