Obtaining outstanding investing results with minimal risk is the holy grail of stock investing.
Most financial advisors recommend investing in index ETFs as a powerful way to achieve that goal. Index ETFs give you wide exposure to the stock market, minimize single stock risk, and allow you to benefit from the continued growth and innovation that drives the U.S. economy.
Two of the most popular index ETFs are QQQ (which tracks the 100 largest non-financial companies in the Nasdaq Composite Index) and SPY (which tracks the S&P 500, the largest 500 companies in the stock market).
We undertook the challenge of beating QQQ’s and SPY’s outstanding performance over the last eight and a half years.
We compared buying and holding SPY and QQQ vs. various strategies that use our Market Trend Advisory (MTA) system.
We also compared the drawdowns in QQQ and SPY vs. each of our strategies. Drawdown and volatility are very important to understand when investing in any equity ETF or stock. An amazing return with an equally large drawdown is not a viable strategy in the real world.
We tested many combinations of our Market Trend and Market Count indicators, including going short during market corrections, and we came out with just two strategies that had the right combination of high-octane performance and low risk (low drawdowns).
This case study is going to review the winning strategies in detail, comparing their performance and drawdowns vs. the ETFs.
Our previous case study compared results from January 2017 through April 2021.In this new case study, with more data across a longer period, we found more powerful variants of our original Market Count strategy. These strategies strongly outperformed buy and hold with less volatility, better risk control, and reduced drawdowns.
Case Study Parameters
Data Period
Our data period started on July 10, 2013. July 11,,2013 was the start of a newly confirmed uptrend and also the earliest date we could obtain and prepare the data needed.
QQQ Chart: July 11, 2013 – January 28, 2022
(click to enlarge chart):

SPY Chart: July 11, 2013 – January 28, 2022
(click to enlarge chart):
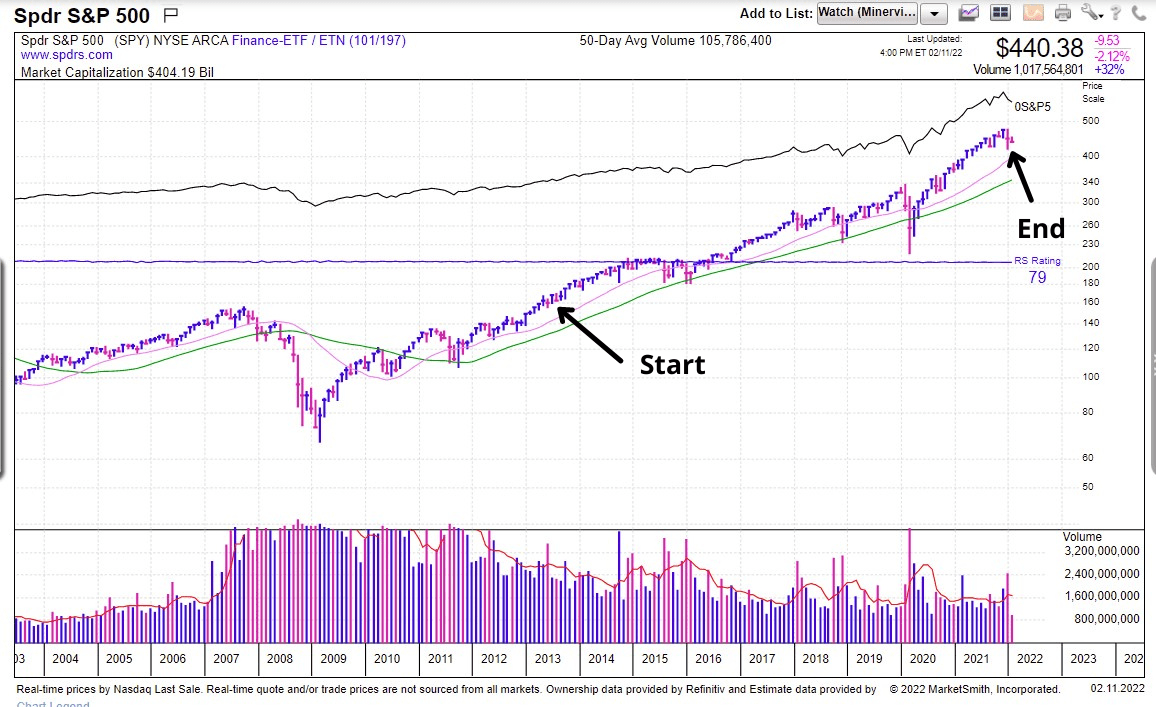
For those who may be wondering, we did not start at this date to best fit the strategies to the data. The QQQ and SPY were already in a powerful uptrend for almost 4 years prior, starting at the March 2009 bottom that ended the financial crisis bear market that started in 2007. Our results would have been even stronger if we included data back to 2007 because our strategies incorporate a powerful market timing system that would have kept investors out of the market for the majority of the 2007-2008 bear market.
We ended the case study on January 28, 2022, when a market correction ended and the trend returned to Market in Uptrend, the start of a newly confirmed uptrend.
Next Day’s Price
For each strategy, we used the next day’s opening price after any buy or sell signals to calculate the returns. This enables users to get similar results in the real world.
QQQ and SPY Returns Overview
The period from 2013 to 2021 was part of an extraordinary stock mega bull market that started in March 2009. It continued through the end of 2021, with arguable a blow-off run in 2020-2021 that may mark long-term highs for the indexes.
Large-cap stocks, especially the FANG stocks, grew into mega-caps worth trillions of dollars, sending the Nasdaq 100 and S&P 500 on an epic eleven-year long bull market.
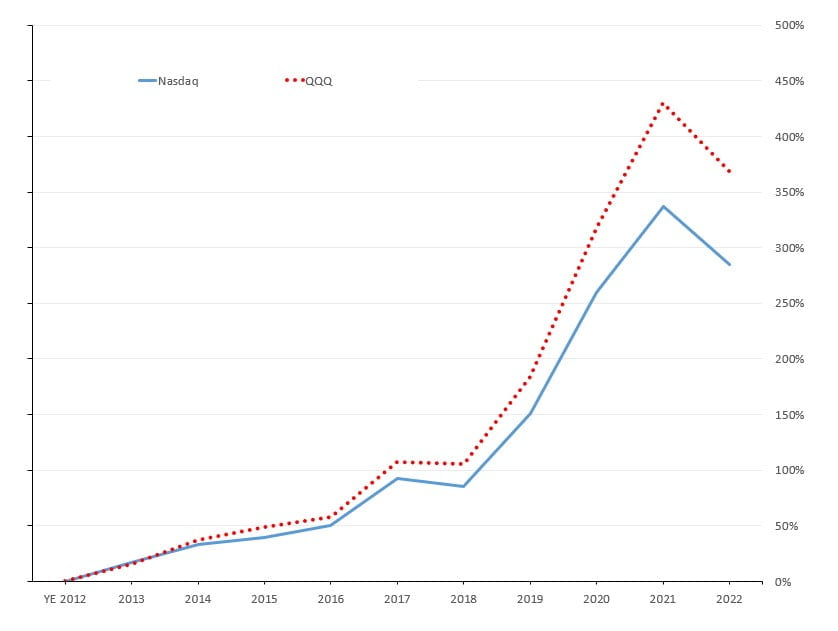
The QQQ, representing the Nasdaq 100 (the top 100 stocks in the Nasdaq by market cap, excluding financials), greatly outperformed the Nasdaq with a 368.95% return vs. the Nasdaq’s 284.70% return.
QQQ vs. Nasdaq Chart
(click to enlarge chart)
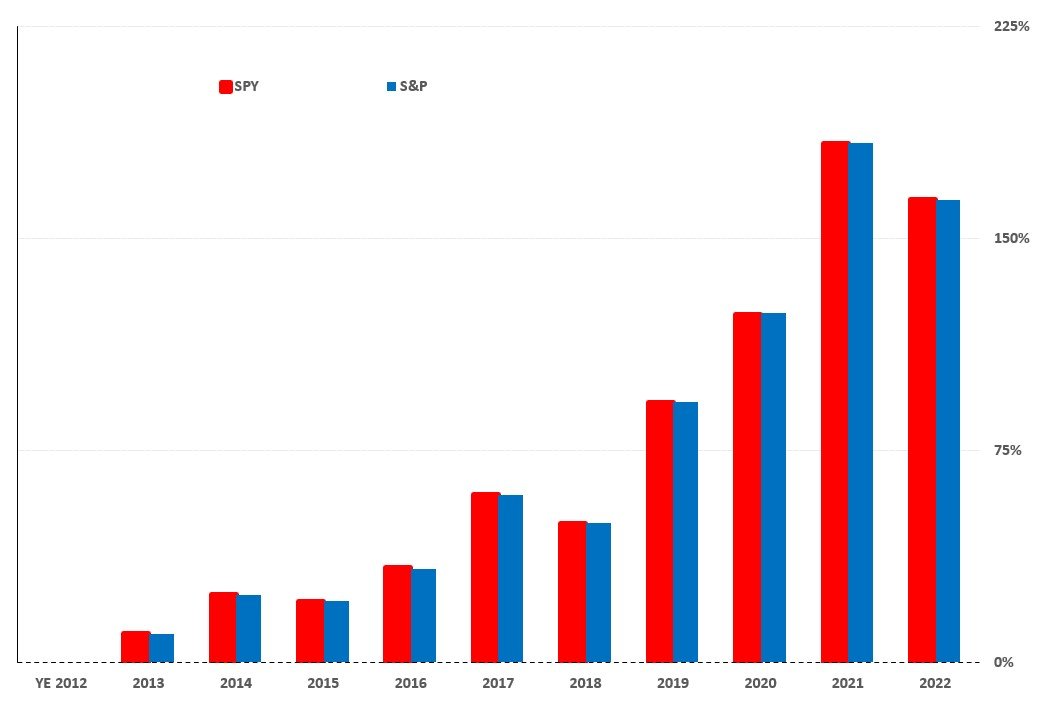
The SPY tracked the S&P 500 very closely. The S&P 500 and the SPY ETF returns were almost equal, with 163.77% and 163.84% respectively.
SPY vs. S&P 500 Chart
(click to enlarge chart)
Corrections & Bear Markets
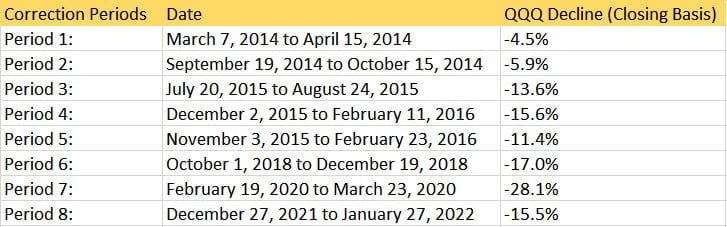
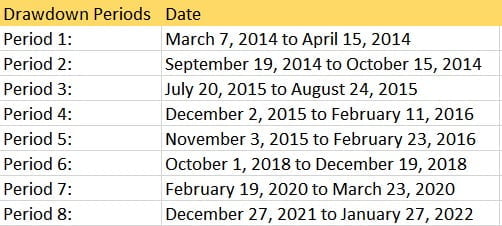
Over the last 8 ½ years, the market experienced many corrections. We chose eight periods – seven of the largest corrections plus one bear market – to see how the strategies performed and the drawdown incurred for each. We will use these periods to compare drawdowns.
QQQ Correction Periods Chart
(click to enlarge chart)

SPY Correction Periods Chart
(click to enlarge chart)

Most corrections lasted 1 to 2 months and the majority were intermediate declines of 10%-16%. The was only one true bear market on a closing basis – the coronavirus bear of Feb 19, 2020 through March 23, 2020.
Understanding Drawdowns
Drawdown refers to the amount an account declines from a high to a low over a given period of time.
Many strategies can vastly outperform the market indexes, but a large drawdown may make any particular strategy not advisable or viable to use.
For example, a strategy that can return 100% a year but has a drawdown of 70% is too volatile. Most people cannot sit through this amount of volatility and will end up selling at the bottom of the correction.
Our Investing Strategies
After testing numerous strategies that either underperformed or had too much volatility/ drawdown, we ended up with two that outperformed buying and holding the index ETFs while providing less overall drawdowns.
QQQ: The Results
So how do the Market Trend Advisory’s results compare to buying and holding the QQQ?
QQQ Buy & Hold vs. MTA Strategies – Cumulative Return
The first line chart shows the cumulative return from July 11, 2013 through January 28, 2022 for our two strategies and the QQQ. The QQQ’s return is the red dotted line.
QQQ vs. Market Count Strategies Cumulative Return
(Click chart to enlarge)

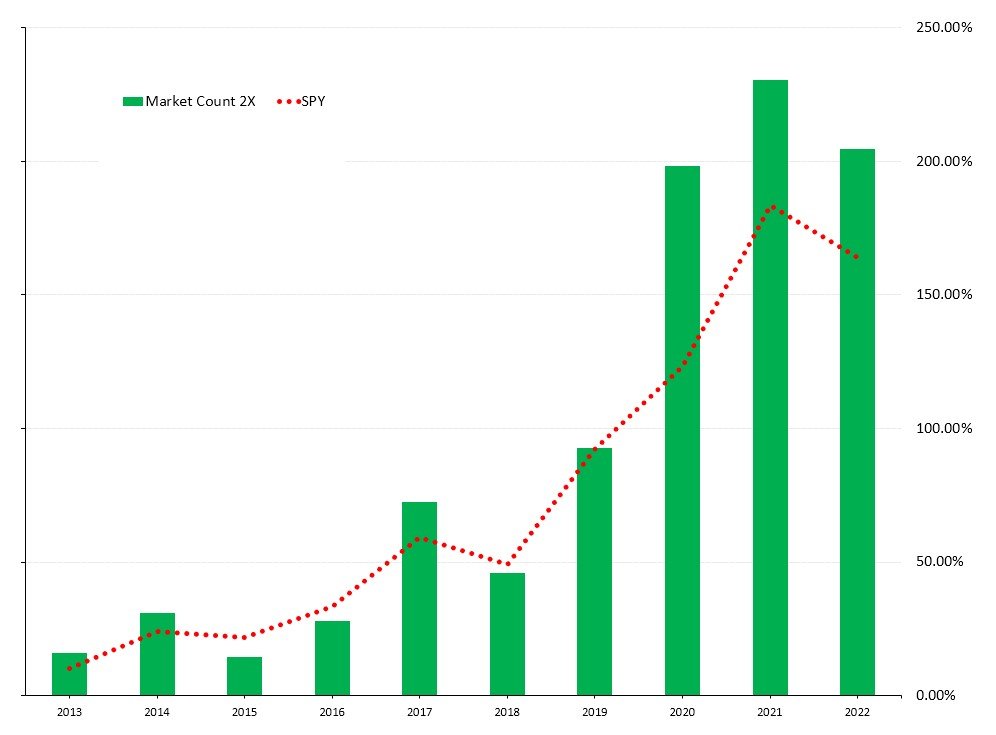
The second chart shows the same data in bar chart format:
QQQ vs. Market Count Strategies Cumulative Return
(Click chart to enlarge)
 The following chart shows the same data in table format:
QQQ vs. Market Count Strategies Cumulative Return
(Click chart to enlarge)

Our two strategies beat buy and hold every year except when the Market Count 2X strategy slightly underperformed in 2015. But starting in 2018 when the bull market accelerated, our strategies strongly outperformed the QQQ.
The QQQ ended with a 368.95% return, a phenomenal return for a stock index ETF.
Our Market Count 3X strategy (green bars) exploded higher and ended up with a 228.73% increase over QQQ buy and hold, for an amazing 1,212.84% return.
Our Market Count 2X strategy (blue bars) ended up with a 45.23% increase over QQQ buy and hold, for a 535.82% return.
How Do The Strategies Work?
The strategies use a rules-based mechanical system that tracks the market using our Market Count system.
The system uses the Nasdaq’s daily closes in conjunction with its technical makeup around key moving averages, combined with institutional buying and selling signals. The Market Count system is an objective market timing system that’s designed to automatically exit a market that’s performing poorly, thus avoiding major corrections and bear markets, and automatically enter (and stay invested) in all major uptrends and bull markets.
With an automatic system, there are no emotions involved or second-guessing the market’s status. It buys and sells according to what the market is actually doing, not what we think it will do or hope it will do.
We combine this with leverage – the Market Count 2X uses the ProShares Ultra QQQ ETF (QLD) for 2X leverage, while the Market Count 3X uses the ProShares UltraPro QQQ ETF (TQQQ) for 3X leverage. Both these ETFs have excellent liquidity and tight spreads between the bid and ask. The leveraged positions are tightly controlled to reduce volatility in downtrends and tough market conditions but generate maximum profits in strong uptrends.
Individual Strategy Closeups
Let’s look more closely at each strategy. While reviewing cumulative performance is instructive, we’re going to look at annual performance and specific period drawdowns vs. the QQQ.
Market Count 2X Strategy
Market Count 2X Strategy Annual Returns
(Click chart to enlarge)


Past performance is no indication of future results.
Market Count 2X Strategy Drawdowns
(Click chart to enlarge)

Past performance is no indication of future results.
Drawdown Period Chart
(Click chart to enlarge)
Average number of trades each year: 35
Average trades per month: 3
Market Count 2X strategy uses the Market Trend Advisory’s Market Count, Percent Invested, and Power Trend indicators with the ProShares Ultra QQQ ETF (QLD) which provides double (2X) exposure compared to the QQQ.
The strategy is designed to reduce volatility and ensure full investment when the market is rallying strongly (using the Power Trend indicator), and a gradual exit when the market starts to decline.
Controlling risk is very important when using any kind of leverage. Leverage is amazing when the market is going your way, but it can quickly wipe out all gains and create large losses if not expertly managed.
Because the Market Count 2X strategy’s buy and sell signals follow the market’s technical setup and institutional buying/ selling footprints, it will gradually move investors in and out of the market. The main key here is that it will catch all major uptrends and avoid all major downtrends and bear markets while delivering a superior return.
This strategy outperformed the QQQ seven out of ten years, with exceptional gains in four out of those six years.
It had only one year that showed a 4.7% loss vs. an 8.3% gain for the QQQ.
For the two years where the QQQ showed a loss – 2015 and 2022 (through January 28th) – the strategy beat with smaller losses.
Its worst loss was 6.1% in 2022, beating the QQQ’s 11.6% decline.
Drawdowns
The Market Count 2X strategy excels in creating minimal drawdowns even with the use of leverage.
Drawdowns were lower every year vs. QQQ, sometimes significantly so. In five out of eight years the drawdowns were under 6.5%.
From December 2, 2015 through February 11, 2016 (Period 4), the QQQ declined 15.6% while the Market Count 2X only declined 2.7%.
Even during powerful bear markets, Market Count 2X provided a better return. The 2020 coronavirus bear market only resulted in a 16.2% decline for our strategy vs. 28.1% for the QQQ.
Market Count 3X Strategy:
Market Count 3X Strategy Annual Returns
(Click chart to enlarge)
 Past performance is no indication of future results.
Market Count 3X Strategy Drawdowns
(Click chart to enlarge)

Past performance is no indication of future results.
Drawdown Period Chart
(Click chart to enlarge)
Average number of trades each year: 35
Average trades per month: 3
The Market Count 3X strategy also uses the Market Trend Advisory’s Market Count, Percent Invested, and Power Trend indicators with the ProShares UltraPro QQQ ETF (TQQQ) which provides triple (3X) exposure compared to the QQQ. The TQQQ has excellent liquidity and tight spreads between the bid and ask.
It’s also designed to reduce volatility and ensure full investment when the market is in a strong bull market and a quick exit when the market starts to decline during corrections.
As with the Market Count 2X strategy, the Market Count 3X strategy’s buy and sell signals follow the market’s technical setup and institutional buying & selling footprints, gradually moving investors in and out of the market. The main key here is that the strategy will catch all major uptrends and avoid all major downtrends and bear markets while delivering a superior return.
The Market Count 3X strategy outperformed the QQQ seven out of ten years, with exceptional gains in four out of those six years.
It had only one year that showed a loss vs. a gain for the QQQ.
In the two years where the QQQ ended with a loss, the strategy ended with one year having a slightly better return, and once slightly worse. Its worst loss was -9.2% in 2022 (through January 28th).
In strong uptrending markets, the Market Count 3X strategy provided outstanding returns. It was up 77.6% in 2017, 73.9% in 2019, and 120.9% in 2020.
Drawdowns
This strategy also excels in creating minimal drawdowns even with the use of high leverage – in five out of eight periods the drawdowns were under 9.5%.
It also outperformed the QQQ’s drawdowns in 6 out of the 8 periods. For example, during Period 4 (December 2, 2015 through February 11, 2016), the QQQ declined 15.6% while the strategy only declined 4.1%.
During the 2020 coronavirus crash, the Market Count 3X strategy slightly outperformed with a 23.6% decline vs. 28.1% for the QQQ, which is exceptional for a strategy using high leverage
SPY: The Results
So how do the Market Trend Advisory’s results compare to buying and holding the SPY ETF vs. our strategies?
SPY Buy & Hold vs. MTA Strategies – Cumulative Return
We found that only one strategy, our Market Count 2X, outperformed with the least amount of volatility and drawdowns.
Market Count 3X had the best return (up 359.46%) but it had too much volatility and drawdown to be useful against SPY. It didn’t make our cut.
The first line chart shows the cumulative returns from July 11, 2013 through January 28, 2022. The SPY’s return is the red dotted line.
SPY vs. Market Count Strategies Cumulative Return
(Click chart to enlarge)

The second chart shows the same data in bar chart format:
SPY vs. Market Count Strategies Cumulative Return
(Click chart to enlarge)
The following chart shows the same data in table format:
SPY vs. Market Count Strategies Cumulative Return
(Click chart to enlarge)

The Market Count 2X strategy’s cumulative return was 204.77% vs. 163.84% for the SPY.
The Market Count 2X strategy beat buy and hold in 2013, 2014, and 2017. It underperformed a little in 2015, 2016, and 2018, and was even in 2019. But starting in 2020 when the bull market accelerated, the strategy greatly outperformed SPY.
How Does The Strategy Work?
Our Market Count 2X strategy uses a rules-based mechanical system that tracks the market using our Market Count system. The system uses the S&P 500’s daily closes in conjunction with its technical makeup around key moving averages, combined with institutional buying and selling signals. The Market Count is a simple yet powerful rules-based market timing system that’s designed to automatically exit a market that’s performing poorly, thus avoiding major corrections and bear markets, and automatically enter (and stay invested) in all major uptrends and bull markets.
With an automatic system, there are no emotions involved or second-guessing the market’s status. It buys and sells according to what the market is actually doing, not what we think it will do or hope it will do.
We combine this with leverage – the Market Count 2X strategy uses the ProShares Ultra S&P500 ETF (SSO) for 2X leverage to the S&P. SSO has excellent liquidity and tight spreads between the bid and ask. Leverage is tightly controlled to reduce volatility in downtrends and tough market conditions but generates maximum profits in strong uptrends.
Market Count 2X Strategy Closeup
Let’s look more closely at the Market Count 2X Strategy results. While reviewing cumulative performance is instructive, we’re going to look at annual performance and specific period drawdowns vs. the SPY.
Market Count 2X Strategy Annual Returns
(Click chart to enlarge)

Past performance is no indication of future results.
Market Count 2X Strategy Drawdowns
(Click chart to enlarge)

Past performance is no indication of future results.
Drawdown Period Chart
(Click chart to enlarge)
Average number of trades each year: 33
Average trades per month: 3
This strategy uses the MTA’s Market Count, Percent Invested, and Power Trend indicators with the SSO ETF which provides double (200%) exposure compared to SPY.
The Market Count 2X strategy is designed to reduce volatility and ensure full investment when the market rallies strongly and gradually exits when the market trend starts to decline. Risk control is important when using any kind of leverage. Leverage is amazing when the market is going your way, but it can quickly wipe out any gains and create large losses if it is not respected.
Because its buy and sell signals follow the market’s technical setup and institutional buying/ selling footprints, it will gradually move investors in and out of the market. The main key here is that it will catch all major uptrends and avoid all major downtrends and bear markets while delivering a solid return.
This strategy outperformed SPY six out of ten years, with exceptional gains in two out of those six years.
For the three years the SPY ended down for the year, Market Count 2X underperformed.
Drawdowns
The Market Count 2X strategy excels in creating minimal drawdowns even with the use of leverage. Even using high leverage, in six out of eight periods the drawdowns were under 10.3%.
Drawdowns were less every period but one, sometimes significantly so. For example, during Period 3 (July 20, 2015 through August 24, 2015), the SPY declined 10.9% while the strategy only declined 1.0%. Only twice did the Market Count 2X’s drawdown exceed buy and hold, with a –2.0% and -6.1% difference.
During the coronavirus bear market, the drawdown was minimal compared to buy and hold. It had a 10.2% decline vs. 34.1% for SPY.
In Conclusion
A superior investment strategy must provide outstanding returns while using some form of market timing to avoid major corrections and bear markets that can destroy years of gains.
In hindsight, buy and hold has provided an easy-to-implement strategy for making money in the stock market. The mega stock bull market from March 2009 through the end of 2021 lulled investors to think the market only goes up.
The truth is that the stock market will eventually experience another extended bear market similar to 2000 to 2002, 2007 to 2009, or 1973 to 1974. Stock market cycles follow the economic expansion and contraction cycles, and a major recession will one day hit the U.S. recession, bringing on a powerful bear market.
This bear market will devastate investors who buy and hold and will end up destroying years if not decades of gains.
Our Market Trend Advisory, with its Market Count investment strategies, can provide exceptional returns without the risk of a major correction or bear market wiping out years of hard-earned profits.
If you’re not already a subscriber, click the button below to learn more about the Market Trend Advisory and get a free 7-day trial.
—————————————————————-


Steve Cochran
Hi,
Great research. Question, for MTA Scenario 4, what was bought/sold in those 110 trades? Just in and out of QQQ as the percentages dictated?
Separate question, I missed the uptrend change in April. Now here in July, what is your recommended approach to get integrated into that system?
Thanks,
Steve
Michael
Scenario 4 is following the Growth Stock % Recommendations each day. Look at the Nasdaq index info on April 21, 2020. Because of the poor market action that day, the system went from 100% invested to 75%. You would have sold 25% of QQQ that day. The following day the market firmed up and the signal changed back to 100%. You would have bought back the shares sold to get back to 100%. It has been at 100% since April 22nd, showing the power of this uptrend!
I myself am waiting to apply the system to a new account. Ideally, you start at the beginning of a new uptrend. I would wait now until a pullback to the 21-day or 50-day, then wait for a powerful move back up.
Marty Powell
Thank you very much for the info. It is very helpful. I subscribed to your system when the market in uptrend was continuing and I have not entered into a position. Waiting for a pull back that never seems to materialize. You suggested in your last response on July 6th to wait for a pullback to either the 21-day or 50-day moving. I’m looking at SPY.. Do you prefer one of these MAs over the other for an entry into the market?
Marty Powell
As a follow up to my last comment, I did wait to get started by waiting until this last “market in downtrend” appeared. Then, when we went back to “market in uptrend” I entered into the market. So far, so good! Thank you.
Michael
You’re welcome. The system always works!
Ming Chieh Chang
If the investment ratio of ETF is increased from 50% to 100%
Double the number of shares or double the amount?
Thanks for your research
It helps me a lot
Kal Seehra
Hi Michael,
I found your case study to be very informative. Your investing foundation seems to be based on IBD fundamentals, which I have followed for some time now. I was wondering if you know why your performance not only beats QQQ buy and hold, but also appears to beat IDB’s Leaderboard performance significantly, which of course is also based on IBD fundamentals. Thanks.
Michael
Hi Kal,
IBD’s Leaderboard is buying individual stocks vs. the case study is buying QQQ or SPY. You can’t really compare the two.
Raymond
Hello, Thanks for sharing this great research. I have a question though, which moving averages did you use on QQQ and SPY charts?
Thanks!
Michael
exponential 21-day and simple 50-day.