June 17, 2013
I wanted to followup on my Hewlett-Packard trade placed back in November 2012, when I bought shares at 11.52. Here is a chart through today:

(Click chart to enlarge)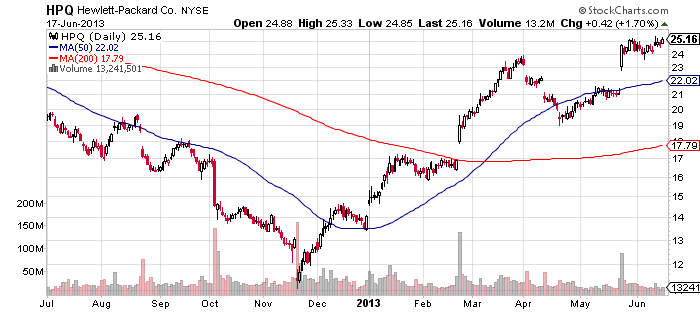

This chart shows a classic decline and panic V bottom in November. I purchased the stock on November 20, the panic day. Notice the huge volume outline in the red spike on that day. This was the highest volume so far.
You have to be willing to step up and buy when sentiment is terrible towards an investment. I had been watching HP for some time, and the news and sentiment was totally negative towards the company. It culminated in that final gap down on November 20th. This was my signal to buy. I had placed my stop-loss just below that low of that day. But my stop was not triggered.


Leave a Reply